 |
| source: dataschool.io |
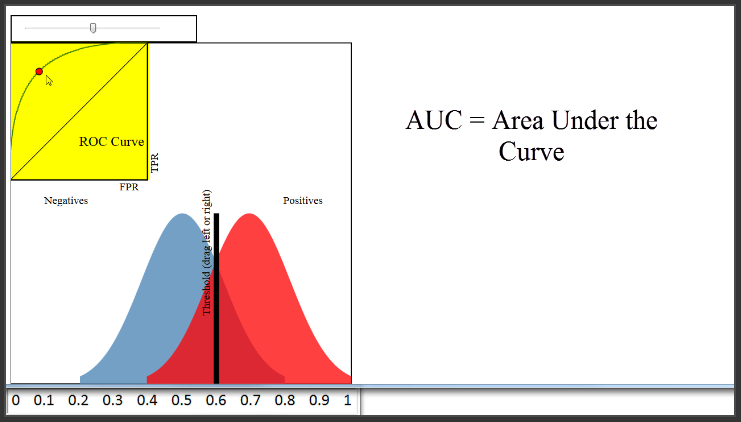
| Key Points | Receiver Operating Characteristic (ROC), or ROC curve, is a graphical plot that illustrates the performance of a binary classifier system as its discrimination threshold is varied. [wikipedia] Area Under the Curve. AUC is literally just the percentage of this box that is under this curve.[video transcript; explains it very calm and easy to follow using a demo app] | |
| Further Links | http://www.navan.name/roc/ | |
| Webinar Category | Data Science | |
| Title | ROC curves and Area Under the Curve explained | |
| Presenter_Name | Markham, Kevin | |
| Provider | Data School | |
| Partner | ||
| Runtime | 0:14:00 | |
Comments
Post a Comment